Skip to content

Concept demo

How the reasoning is meant to work, one step at a time.

Four hand-written scenarios walk through the proposed workflow: evidence, assessment, possible causes, knowledge, options, sustainability, limits and a summary. Nothing here calls a server or runs a model.

Interactive concept demonstration - illustrative data, not a live AI diagnosis.

1 · Choose a scenario

2 · Walk through the reasoning

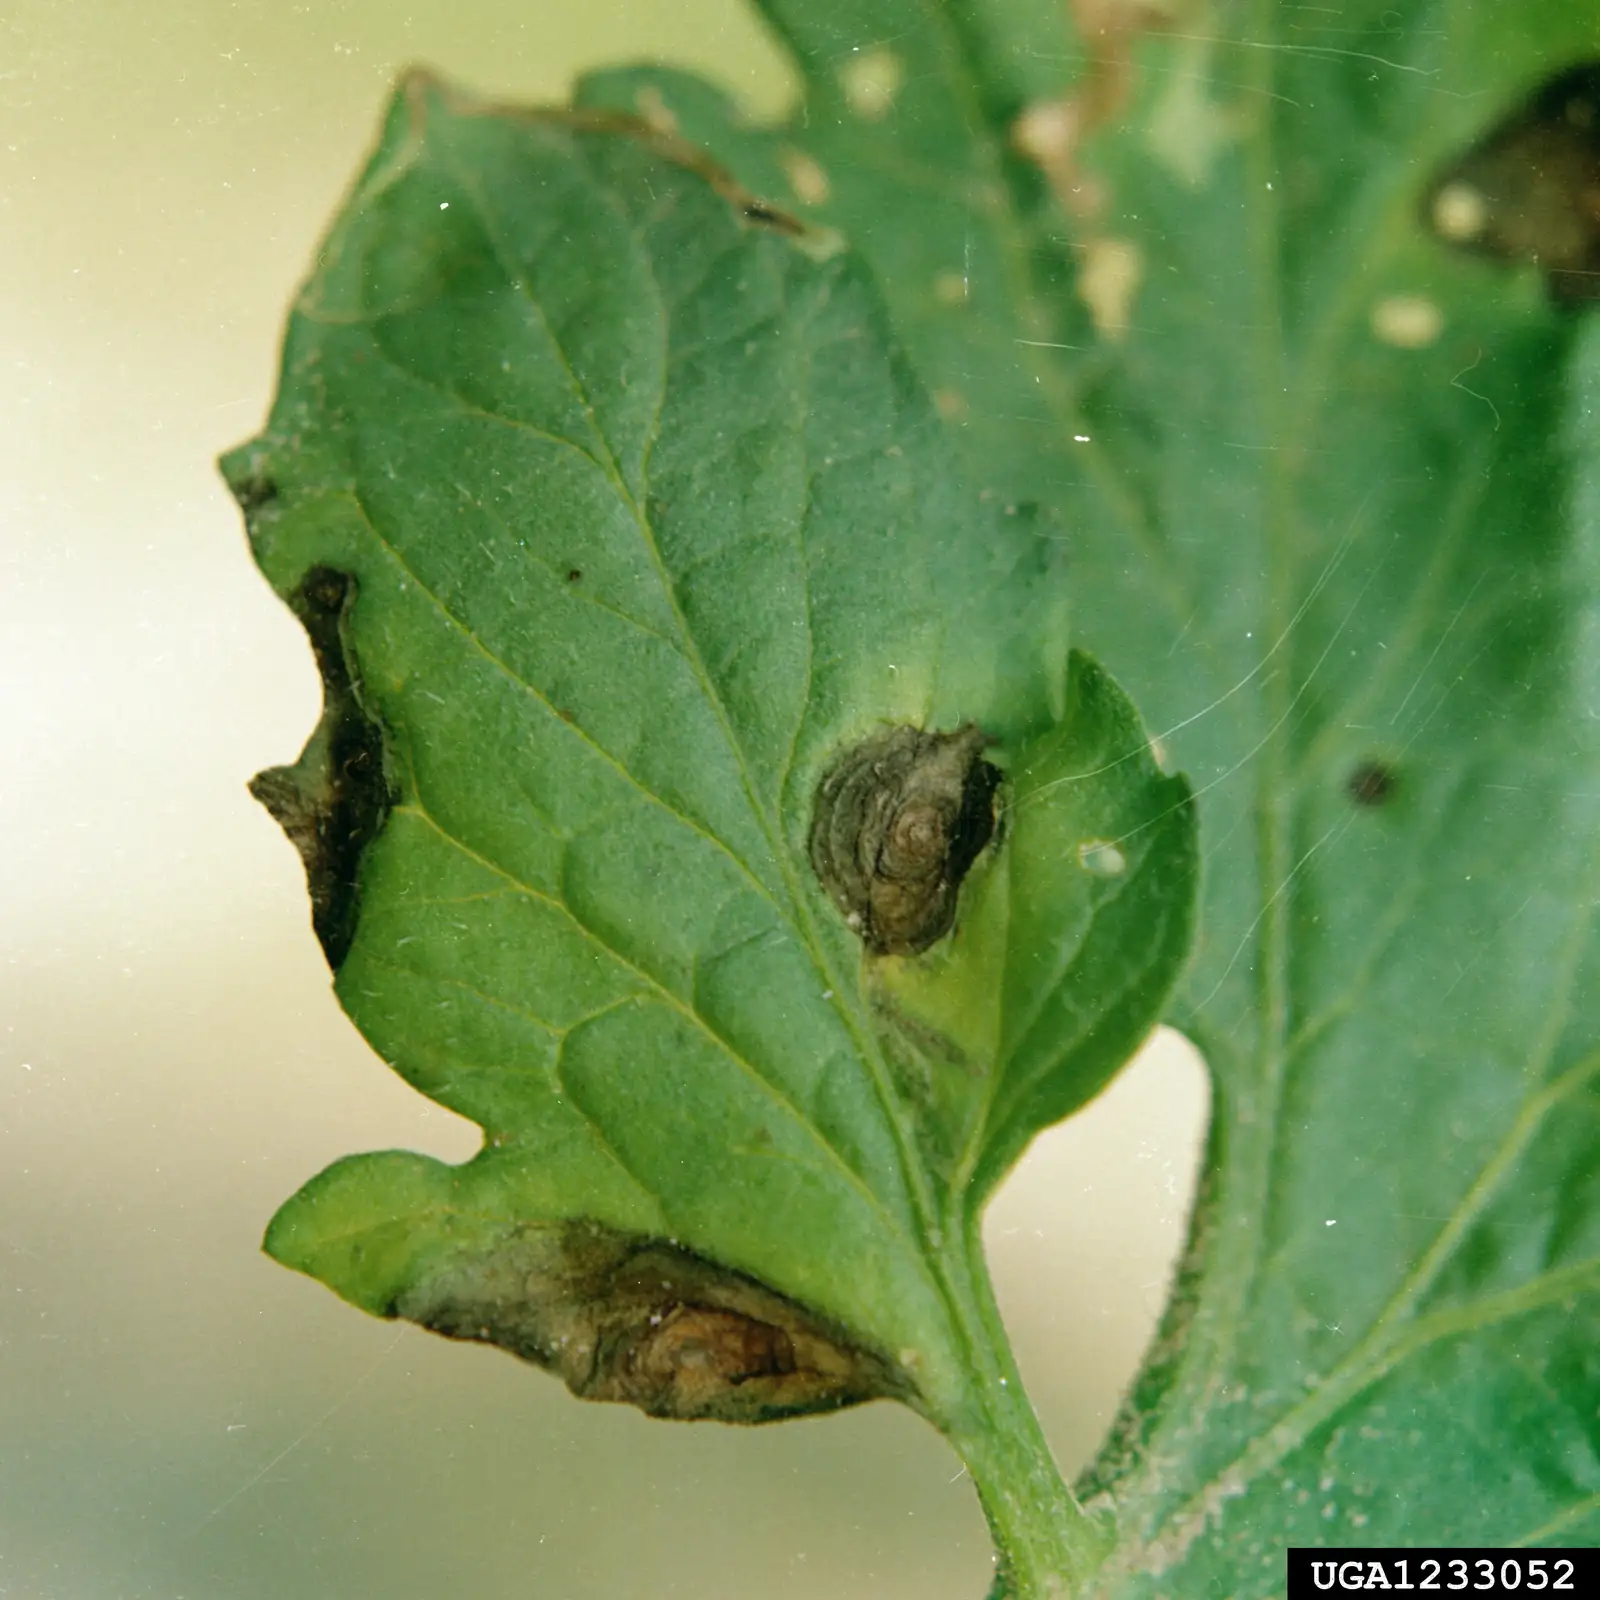
Close-up of a tomato leaf with dark, concentric-ringed lesions typical of early blight.
Target-shaped lesions of Alternaria solani (early blight) on a tomato leaf. Photo: Clemson University – USDA Cooperative Extension Slide Series (opens in a new tab), CC BY 3.0 US.

Compare with your own photo (optional)

Your photo stays in this browser tab. It is not uploaded, stored or analyzed - nothing on this page runs a model.

Step 1 of 8 · Input evidence

Input evidence

A farmer photographs an affected leaf and adds a short note. The photo is linked to an existing plot and crop cycle.

Crop & stage
Tomato, vegetative growth
Farmer note
“Brown spots on the bottom leaves, spreading upward.”
Plot history
Tomato grown on the same plot last season (illustrative)
Recent weather
Several humid, overcast days (illustrative)

Curious how each stage is implemented, and which parts are still being validated?

See the real pipeline